College Ready

Sharing strategies for student success, college readiness and academic coaching


Leave a comment

Tutorial: How to Make an Infographic using Piktochart.

This is an amazing tutorial, with step-by-step instructions, on “How to Make an Infographic” using Piktochart, by Mia MacMeekin. I always find her infographics engaging and easy to follow, so I was excited that she did this tutorial and thought it was worth sharing. Like she says, she finds them “simple” to do , but simple often means “hundreds of hours playing w Piktochart.” Still, it’s a skill all 21st educators are going to want to add to their toolbox…so here it is. Enjoy.

An Ethical Island

Hello, World!

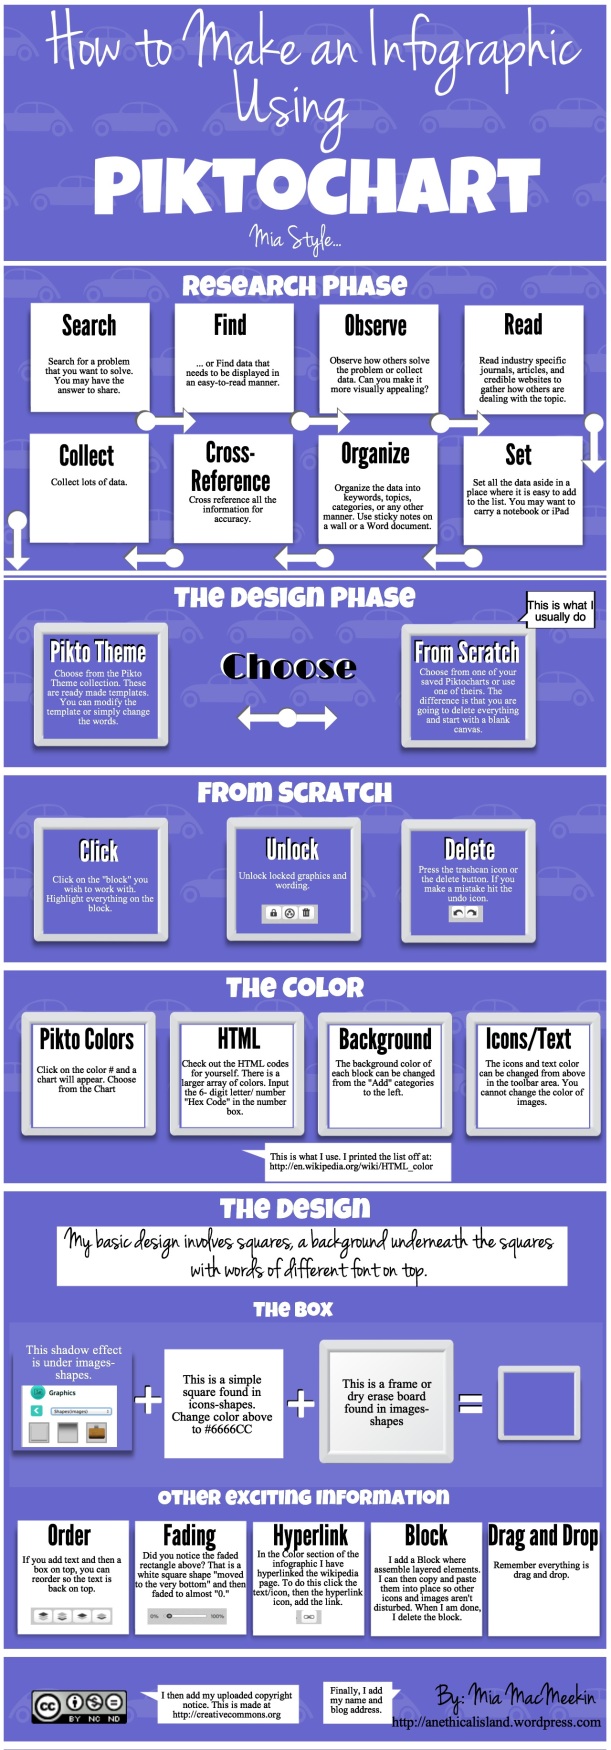
Lots of my friends have been asking me how I make the infographics. I find it very simple. But, I admit that that simple mindset is after hundreds of hours playing with Piktochart. I think I know most of the quirks. Well that was I did until last week when Piktochart updated the website. BUT, I am getting used to the new platform and love it!

Here is a quick overview of how I make them…

How to Make a Piktochart infogrpahic

~Mia

View original post


2 Comments

Infographic Thursday 8-1-2013: Social Media, Business and Writing

Social Media Infographics from Communication Made Simple. I like the ones that show how students interact with social, but it is also interesting to see the impact business people place on LinkedIn.

Marty F. Nemec

It’s Infographic Thursday, the best day of the week!

I have 10 infographics for you ranging from the subjects of social media and business to writing and gender differences of social media use. I also made the graphics bigger so you no longer have to click them to read them. I’m sorry about that!

IGT 3-1

IGT 3-2

IGT 3-3

IGT 3-4

IGT 3-5

IGT 3-6

IGT 3-7

IGT 3-8

IGT 3-9

IGT 3-10

Do you like any of these infographics? Let me know in the comment section or better yet, share it on Twitter! I love infographics.

-Marty F. Nemec

View Marty F. Nemec's profile on LinkedIn

View original post